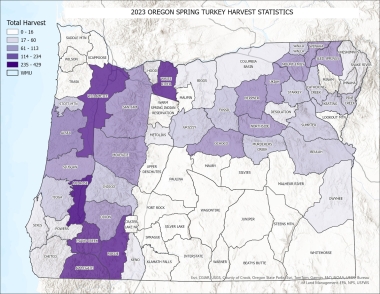
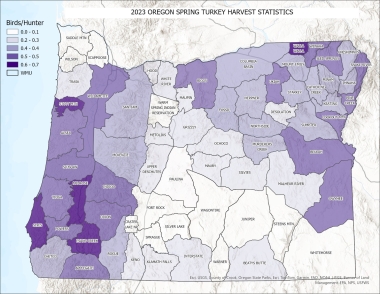
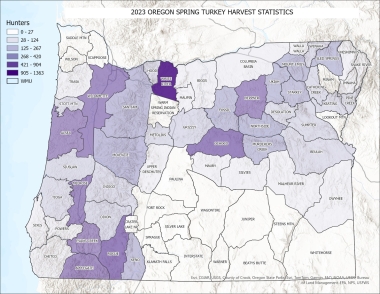
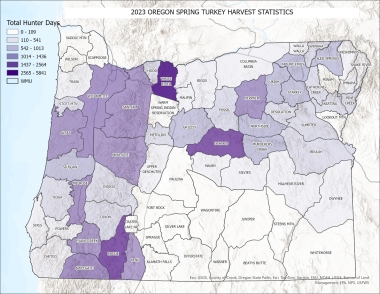
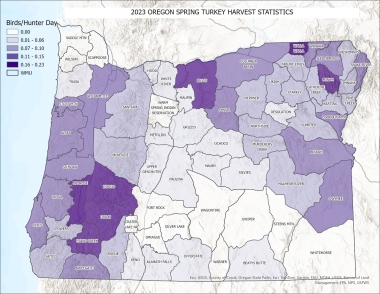
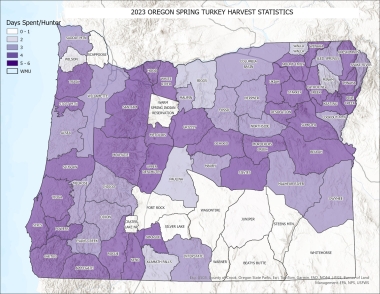
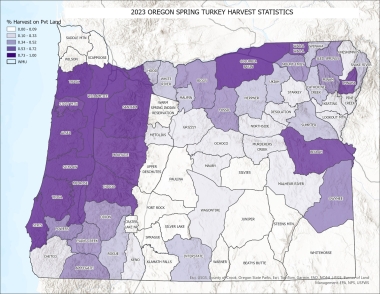
2023 Spring Turkey Harvest by WMU
Maps showing harvest, hunter days, birds per hunter, and percent of birds harvested on public land are included below the table.
The table is sorted by harvest (largest to smallest)
|
Unit
|
Unit Name
|
Hunters
|
Hunter Days*
|
Days/ Hunter
|
Turkey Harvest
|
Birds/ Hunter
|
Birds/ Hunter Day
|
Harvest on Pvt Land
|
|
|
23
|
Melrose
|
674
|
2,242
|
3.3
|
429
|
0.64
|
0.19
|
89%
|
|
|
41
|
White River
|
1,363
|
5,841
|
4.3
|
333
|
0.24
|
0.06
|
43%
|
|
|
30
|
Rogue
|
904
|
3,702
|
4.1
|
333
|
0.37
|
0.09
|
52%
|
|
|
15
|
Willamette
|
646
|
2,436
|
3.8
|
328
|
0.51
|
0.13
|
94%
|
|
|
28
|
Applegate
|
631
|
2,564
|
4.1
|
306
|
0.48
|
0.12
|
63%
|
|
|
29
|
Evans Creek
|
521
|
1,891
|
3.6
|
304
|
0.58
|
0.16
|
57%
|
|
|
18
|
Alsea
|
523
|
1,940
|
3.7
|
234
|
0.45
|
0.12
|
93%
|
|
|
48
|
Heppner
|
555
|
2,052
|
3.7
|
177
|
0.32
|
0.09
|
38%
|
|
|
19
|
Mckenzie
|
420
|
1,785
|
4.3
|
173
|
0.41
|
0.10
|
87%
|
|
|
16
|
Santiam
|
402
|
2,034
|
5.1
|
155
|
0.39
|
0.08
|
92%
|
|
|
37
|
Ochoco
|
818
|
3,413
|
4.2
|
151
|
0.18
|
0.04
|
19%
|
|
|
57
|
Sled Springs
|
311
|
1,186
|
3.8
|
151
|
0.49
|
0.13
|
66%
|
|
|
22
|
Dixon
|
267
|
863
|
3.2
|
142
|
0.53
|
0.16
|
54%
|
|
|
49
|
Ukiah
|
313
|
1,335
|
4.3
|
138
|
0.44
|
0.10
|
52%
|
|
|
54
|
Mt. Emily
|
342
|
1,436
|
4.2
|
137
|
0.40
|
0.10
|
64%
|
|
|
20
|
Siuslaw
|
244
|
1,091
|
4.5
|
131
|
0.54
|
0.12
|
93%
|
|
|
47
|
Northside
|
365
|
1,352
|
3.7
|
127
|
0.35
|
0.09
|
27%
|
|
|
56
|
Wenaha
|
243
|
1,013
|
4.2
|
122
|
0.50
|
0.12
|
43%
|
|
|
45
|
Fossil
|
285
|
893
|
3.1
|
113
|
0.40
|
0.13
|
56%
|
|
|
21
|
Indigo
|
199
|
633
|
3.2
|
108
|
0.54
|
0.17
|
87%
|
|
|
52
|
Starkey
|
276
|
1,242
|
4.5
|
104
|
0.38
|
0.08
|
20%
|
|
|
17
|
Stott Mtn
|
169
|
800
|
4.7
|
96
|
0.57
|
0.12
|
84%
|
|
|
55
|
Walla Walla
|
124
|
371
|
3.0
|
86
|
0.69
|
0.23
|
80%
|
|
|
46
|
Murderers Crk
|
280
|
1,217
|
4.4
|
85
|
0.30
|
0.07
|
31%
|
|
|
53
|
Catherine Crk
|
226
|
956
|
4.2
|
77
|
0.34
|
0.08
|
44%
|
|
|
24
|
Tioga
|
163
|
670
|
4.1
|
77
|
0.47
|
0.11
|
92%
|
|
|
65
|
Beulah
|
155
|
663
|
4.3
|
75
|
0.49
|
0.11
|
79%
|
|
|
51
|
Sumpter
|
204
|
1,001
|
4.9
|
72
|
0.35
|
0.07
|
45%
|
|
|
62
|
Pine Creek
|
161
|
865
|
5.4
|
70
|
0.44
|
0.08
|
20%
|
|
|
63
|
Keating
|
195
|
964
|
4.9
|
69
|
0.35
|
0.07
|
19%
|
|
|
38
|
Grizzly
|
256
|
1,105
|
4.3
|
68
|
0.26
|
0.06
|
29%
|
|
|
31
|
Keno
|
355
|
1,723
|
4.9
|
60
|
0.17
|
0.03
|
26%
|
|
|
39
|
Metolius
|
241
|
973
|
4.0
|
52
|
0.22
|
0.05
|
18%
|
|
|
43
|
Biggs
|
109
|
296
|
2.7
|
47
|
0.43
|
0.16
|
58%
|
|
|
25
|
Sixes
|
82
|
391
|
4.8
|
47
|
0.57
|
0.12
|
94%
|
|
|
50
|
Desolation
|
163
|
731
|
4.5
|
44
|
0.27
|
0.06
|
29%
|
|
|
67
|
Owyhee
|
92
|
326
|
3.5
|
44
|
0.48
|
0.14
|
68%
|
|
|
44
|
Columbia Basin
|
113
|
375
|
3.3
|
42
|
0.37
|
0.11
|
97%
|
|
|
58
|
Chesnimus
|
104
|
482
|
4.6
|
35
|
0.34
|
0.07
|
26%
|
|
|
27
|
Chetco
|
83
|
345
|
4.1
|
34
|
0.41
|
0.10
|
31%
|
|
|
59
|
Snake River
|
66
|
259
|
3.9
|
34
|
0.51
|
0.13
|
42%
|
|
|
26
|
Powers
|
64
|
342
|
5.4
|
33
|
0.51
|
0.10
|
72%
|
|
|
61
|
Imnaha
|
81
|
325
|
4.0
|
31
|
0.39
|
0.10
|
83%
|
|
|
42
|
Hood
|
204
|
834
|
4.1
|
26
|
0.13
|
0.03
|
45%
|
|
|
72
|
Silvies
|
72
|
364
|
5.1
|
16
|
0.22
|
0.04
|
8%
|
|
|
66
|
Malheur Rvr
|
60
|
230
|
3.8
|
16
|
0.26
|
0.07
|
17%
|
|
|
34
|
Upp. Deschutes
|
95
|
541
|
5.7
|
14
|
0.15
|
0.03
|
9%
|
|
|
14
|
Trask
|
57
|
278
|
4.9
|
14
|
0.25
|
0.05
|
100%
|
|
|
40
|
Maupin
|
78
|
260
|
3.3
|
13
|
0.17
|
0.05
|
50%
|
|
|
64
|
Lookout Mtn
|
25
|
79
|
3.2
|
12
|
0.47
|
0.15
|
33%
|
|
|
60
|
Minam
|
25
|
57
|
2.3
|
9
|
0.37
|
0.16
|
57%
|
|
|
36
|
Maury
|
57
|
199
|
3.5
|
7
|
0.11
|
0.03
|
20%
|
|
|
75
|
Interstate
|
27
|
109
|
4.0
|
7
|
0.24
|
0.06
|
40%
|
|
|
32
|
Klamath Falls
|
27
|
66
|
2.4
|
4
|
0.14
|
0.06
|
0%
|
|
|
73
|
Wagontire
|
7
|
27
|
4.2
|
4
|
0.60
|
0.01
|
33%
|
|
|
35
|
Paulina
|
13
|
33
|
2.5
|
1
|
0.10
|
0.04
|
0%
|
|
|
70
|
Beaty Butte
|
5
|
34
|
6.5
|
1
|
0.25
|
0.04
|
0%
|
|
|
10
|
Saddle Mtn
|
10
|
38
|
3.6
|
0
|
0.00
|
0.00
|
|
|
|
12
|
Wilson
|
9
|
16
|
1.7
|
0
|
0.00
|
0.00
|
|
|
|
33
|
Sprague
|
4
|
22
|
5.7
|
0
|
0.00
|
0.00
|
|
|
|
71
|
Juniper
|
1
|
1
|
1.0
|
0
|
0.00
|
0.00
|
|
|
|
11
|
Scappoose
|
1
|
18
|
14.0
|
0
|
0.00
|
0.00
|
|
|
|
77
|
Fort Rock
|
0
|
0
|
|
0
|
|
|
|
|
|
76
|
Silver Lake
|
0
|
0
|
|
0
|
|
|
|
|
|
69
|
Steens Mtn
|
0
|
0
|
|
0
|
|
|
|
|
|
74
|
Warner
|
0
|
0
|
|
0
|
|
|
|
|
|
68
|
Whitehorse
|
0
|
0
|
|
0
|
|
|
|
|
*Summary of hunters by WMU is only based off the unit the hunter reported hunting in the most. Therefore, if a hunter hunted in more than one WMU they are only counted in the unit they hunted most. Summary of hunter days by WMU only captures the number of dates a hunter spent in the unit they hunted most.
Total harvest
Birds harvested/hunter
# of hunters
Total hunter days
Birds/hunter
Birds/hunter day
Days spent/hunter
% harvest on private land
Header photo courtesy of the National Wild Turkey Federation.