

2022 spring turkey harvest by unit
See where most turkey harvest, effort happens
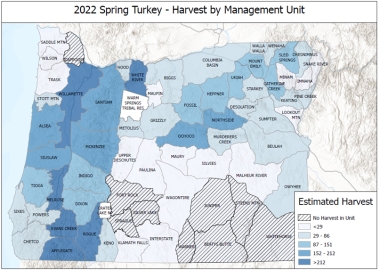
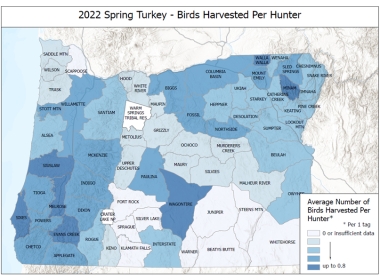
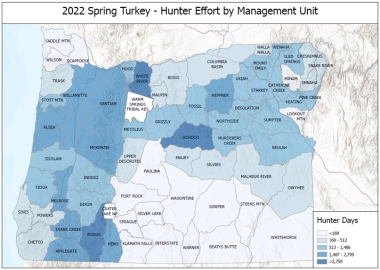
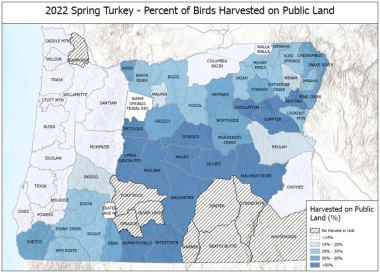
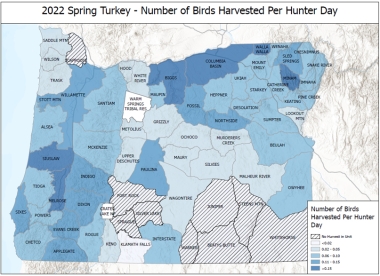
Harvest and effort data can help you identify promising places to hunt. This page includes maps showing harvest, hunter days, birds per hunter, and percent of birds harvested on public land.
2022 Spring Turkey Harvest by Wildlife Management Unit
Maps showing harvest, hunter days, birds per hunter, and percent of birds harvested on public land are included below the table.
The table is sorted by harvest (largest to smallest)
| Unit | Unit Name | Hunters | Hunter Days* | Days/ Hunter | Turkey Harvest | Birds/ Hunter | Birds/ Hunter Day | Harvested on Private Land | |
|
23 |
Melrose |
761 |
2,586 |
3.4 |
465 |
0.61 |
0.18 |
86% |
|
|
30 |
Rogue |
994 |
4,291 |
4.3 |
370 |
0.37 |
0.09 |
44% |
|
|
28 |
Applegate |
667 |
2,759 |
4.1 |
348 |
0.52 |
0.13 |
51% |
|
|
41 |
White River |
1,489 |
6,187 |
4.2 |
336 |
0.23 |
0.05 |
45% |
|
|
15 |
Willamette |
672 |
2,602 |
3.9 |
313 |
0.47 |
0.12 |
96% |
|
|
29 |
Evans Creek |
505 |
2,070 |
4.1 |
304 |
0.60 |
0.15 |
53% |
|
|
18 |
Alsea |
558 |
2,196 |
3.9 |
213 |
0.38 |
0.10 |
92% |
|
|
37 |
Ochoco |
867 |
3,791 |
4.4 |
211 |
0.24 |
0.06 |
10% |
|
|
19 |
Mckenzie |
444 |
1,874 |
4.2 |
198 |
0.45 |
0.11 |
86% |
|
|
16 |
Santiam |
475 |
2,176 |
4.6 |
197 |
0.41 |
0.09 |
89% |
|
|
47 |
Northside |
370 |
1,486 |
4.0 |
189 |
0.51 |
0.13 |
27% |
|
|
20 |
Siuslaw |
268 |
913 |
3.4 |
165 |
0.62 |
0.18 |
97% |
|
|
48 |
Heppner |
498 |
1,944 |
3.9 |
152 |
0.30 |
0.08 |
40% |
|
|
57 |
Sled Springs |
291 |
1,182 |
4.1 |
147 |
0.50 |
0.12 |
54% |
|
|
54 |
Mt. Emily |
321 |
1,376 |
4.3 |
143 |
0.45 |
0.10 |
51% |
|
|
22 |
Dixon |
261 |
952 |
3.6 |
133 |
0.51 |
0.14 |
60% |
|
|
45 |
Fossil |
276 |
947 |
3.4 |
126 |
0.46 |
0.13 |
59% |
|
|
49 |
Ukiah |
323 |
1,274 |
3.9 |
120 |
0.37 |
0.09 |
58% |
|
|
21 |
Indigo |
204 |
723 |
3.6 |
111 |
0.54 |
0.15 |
80% |
|
|
24 |
Tioga |
193 |
1,025 |
5.3 |
93 |
0.48 |
0.09 |
90% |
|
|
53 |
Catherine Crk |
273 |
1,225 |
4.5 |
93 |
0.34 |
0.08 |
49% |
|
|
52 |
Starkey |
245 |
1,166 |
4.8 |
86 |
0.35 |
0.07 |
19% |
|
|
17 |
Stott Mtn |
164 |
737 |
4.5 |
82 |
0.50 |
0.11 |
94% |
|
|
31 |
Keno |
435 |
2,069 |
4.8 |
79 |
0.18 |
0.04 |
25% |
|
|
51 |
Sumpter |
214 |
992 |
4.6 |
79 |
0.37 |
0.08 |
18% |
|
|
55 |
Walla Walla |
125 |
448 |
3.6 |
75 |
0.60 |
0.17 |
90% |
|
|
56 |
Wenaha |
197 |
903 |
4.6 |
73 |
0.37 |
0.08 |
60% |
|
|
46 |
Murderers Crk |
289 |
1,230 |
4.3 |
72 |
0.25 |
0.06 |
21% |
|
|
62 |
Pine Creek |
175 |
889 |
5.1 |
71 |
0.40 |
0.08 |
33% |
|
|
65 |
Beulah |
166 |
835 |
5.0 |
68 |
0.41 |
0.08 |
77% |
|
|
25 |
Sixes |
106 |
430 |
4.1 |
62 |
0.59 |
0.14 |
90% |
|
|
50 |
Desolation |
178 |
732 |
4.1 |
57 |
0.32 |
0.08 |
14% |
|
|
63 |
Keating |
169 |
823 |
4.9 |
55 |
0.33 |
0.07 |
9% |
|
|
44 |
Columbia Basin |
106 |
312 |
3.0 |
50 |
0.48 |
0.16 |
90% |
|
|
42 |
Hood |
272 |
1,331 |
4.9 |
50 |
0.18 |
0.04 |
31% |
|
|
38 |
Grizzly |
236 |
1,434 |
6.1 |
49 |
0.21 |
0.03 |
34% |
|
|
39 |
Metolius |
224 |
1,005 |
4.5 |
49 |
0.22 |
0.05 |
16% |
|
|
43 |
Biggs |
95 |
292 |
3.1 |
46 |
0.49 |
0.16 |
64% |
|
|
58 |
Chesnimus |
125 |
513 |
4.1 |
41 |
0.33 |
0.08 |
28% |
|
|
67 |
Owyhee |
100 |
376 |
3.7 |
40 |
0.40 |
0.11 |
87% |
|
|
26 |
Powers |
85 |
383 |
4.5 |
39 |
0.45 |
0.10 |
87% |
|
|
27 |
Chetco |
89 |
426 |
4.8 |
39 |
0.43 |
0.09 |
33% |
|
|
61 |
Imnaha |
76 |
283 |
3.7 |
28 |
0.37 |
0.10 |
55% |
|
|
59 |
Snake River |
72 |
295 |
4.1 |
26 |
0.36 |
0.09 |
25% |
|
|
60 |
Minam |
33 |
89 |
2.7 |
19 |
0.58 |
0.22 |
80% |
|
|
72 |
Silvies |
81 |
358 |
4.4 |
19 |
0.24 |
0.05 |
7% |
|
|
40 |
Maupin |
84 |
251 |
3.0 |
18 |
0.22 |
0.07 |
71% |
|
|
34 |
Upper Deschutes |
85 |
389 |
4.6 |
18 |
0.21 |
0.05 |
7% |
|
|
66 |
Malheur River |
79 |
345 |
4.4 |
17 |
0.21 |
0.05 |
15% |
|
|
75 |
Interstate |
26 |
117 |
4.6 |
8 |
0.30 |
0.07 |
17% |
|
|
64 |
Lookout Mtn |
21 |
169 |
8.2 |
8 |
0.38 |
0.05 |
50% |
|
|
36 |
Maury |
55 |
233 |
4.2 |
8 |
0.14 |
0.03 |
0% |
|
|
14 |
Trask |
61 |
277 |
4.6 |
8 |
0.13 |
0.03 |
100% |
|
|
73 |
Wagontire |
6 |
153 |
23.8 |
5 |
0.80 |
0.03 |
0% |
|
|
35 |
Paulina |
8 |
30 |
3.8 |
4 |
0.50 |
0.13 |
0% |
|
|
32 |
Klamath Falls |
43 |
151 |
3.5 |
3 |
0.06 |
0.02 |
0% |
|
|
Unknown |
12 |
46 |
4.0 |
3 |
0.22 |
0.06 |
0% |
||
|
10 |
Saddle Mtn |
8 |
28 |
3.7 |
1 |
0.17 |
0.05 |
100% |
|
|
12 |
Wilson |
9 |
32 |
3.6 |
1 |
0.14 |
0.04 |
100% |
|
|
70 |
Beaty Butte |
1 |
3 |
2.0 |
0 |
0.00 |
0.00 |
No Data! |
|
|
77 |
Fort Rock |
4 |
14 |
3.7 |
0 |
0.00 |
0.00 |
No Data |
|
|
71 |
Juniper |
3 |
10 |
4.0 |
0 |
0.00 |
0.00 |
No Data |
|
|
11 |
Scappoose |
4 |
26 |
6.7 |
0 |
0.00 |
0.00 |
No Data |
|
|
76 |
Silver Lake |
5 |
19 |
3.8 |
0 |
0.00 |
0.00 |
No Data |
|
|
33 |
Sprague |
1 |
4 |
3.0 |
0 |
0.00 |
0.00 |
No Data |
|
|
69 |
Steens Mtn |
3 |
133 |
51.5 |
0 |
0.00 |
0.00 |
No Data |
*Summary of hunters by WMU is only based off the unit the hunter reported hunting in the most. Therefore, if a hunter hunted in more than one WMU they are only counted in the unit they hunted most. Summary of hunter days by WMU only captures the number of dates a hunter spent in the unit they hunted most.
Header photo courtesy of the National Wild Turkey Federation.

Check out the Recreation Report
Current conditions and opportunities to hunt, fish and see wildlife. Updated weekly by fish and wildlife biologists throughout the state.