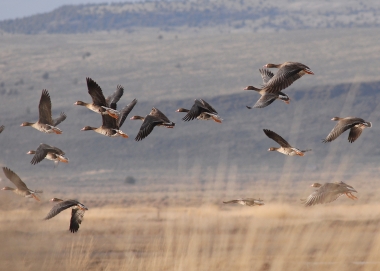
20-21 Summer Lake game bird harvest summaries
Find the weekly statistics for waterfowl and upland game birds at Summer Lake Wildlife Area.
2020-21 Season's Weekly Summaries (pdfs)
Weekly summaries of the number of ducks, geese, and upland game birds harvested each week are shown in the table below. Click on the date for a more detailed summary of total birds harvested by species and date.
Date |
Week |
No. Hunters |
No. Ducks harvested* |
No. Geese harvested |
No. Upland harvested** |
Birds per Hunter |
|---|---|---|---|---|---|---|
| Sept 26 & 27 | 142 | 329 | 53 | n/a | 2.96 | |
| Oct 12-18 | 1 | 356 | 542 | 103 | 21 | 1.95 |
| Oct 19-25 | 2 | 366 | 505 | 219 | 9 | 2.05 |
| Oct 26-Nov 1 | 3 | 197 | 338 | 62 | 6 | 2.06 |
| Nov 2-8 | 4 | 202 | 426 | 46 | 14 | 2.47 |
| Nov 9-15 | 5 | 158 | 305 | 36 | 5 | 2.22 |
| Nov 16-22 | 6 | 147 | 367 | 12 | 3 | 2.61 |
| Nov 23-29 | 7 | 160 | 367 | 12 | 5 | 2.47 |
| Nov 30-Dec 6 | 8 | 79 | 163 | 0 | 1 | 2.11 |
| Dec 7-13 | 9 | 120 | 224 | 0 | 21 | 2.06 |
| Dec 14-20 | 10 | 87 | 160 | 3 | 6 | 1.95 |
| Dec 21-27 | 11 | 99 | 115 | 0 | 12 | 1.36 |
| Dec 28-Jan 1 | 12 | 107 | 121 | 3 | 2 | 1.34 |
| Jan 4-10 | 13 | 74 | 96 | 3 | 6 | 1.45 |
| Jan 11-17 | 14 | 32 | 98 | 6 | 4 | 1.56 |
| Jan 12-14 | 15 | 117 | 118 | 36 | 25 | 1.65 |
| Jan 25-31 | 16 | 57 | CLOSED | 29 | CLOSED | 0.60 |
*Ducks does not include coot
**Upland includes pheasant and California quail
2020-21 Total Harvest Compared to 5 year Average
- 2020-21 Month of October with Comparison to 2019-20 Season
- 2020-21 Month of November with Comparison to 2019-20 Season
- 2020-21 Month of December with Comparison to 2019-20 Season
Previous Years' Harvest
- 2019-20 Harvest Information
- 2018-19 Harvest Information
- 2017-18 Harvest Information
- 2016-17 Harvest Information
- 2015-16 Harvest Information
- 2014-15 Harvest Information
- 2013-14 Harvest Information
- 2012-13 Harvest Information
- 2011-12 Harvest Information
- 2010-11 Harvest Information
- 2009-10 Harvest Information
- 2008-09 Harvest Information
- 2007-08 Harvest Information

